
LV015-coredump应用
一、进程实例
1. 测试程序
#include <stdio.h>

int main(int argc, const char *argv[]) {
    int *p = NULL;

    printf("&p = %p, p = %p\n", &p, p);
    *p = 5;
    printf("*p=%d\n", *p);
    return 0;
}2. ubuntu 中测试
2.1 开启 coredump
ulimit -c unlimited # 不限制产生 core 的大小
echo "core.%e.%p.%t" > /proc/sys/kernel/core_pattern # 在当前目录下生成 core.可执行文件名.pid.转储 unix 时间 的文件这个写入操作需要有 sudo 权限:
$ sudo echo "core.%e.%p.%t" > /proc/sys/kernel/core_pattern
bash: /proc/sys/kernel/core_pattern: 权限不够shell 的重定向 > 在 sudo 执行之前就已经被当前 shell 处理了,所以实际上是以普通用户权限尝试写入该文件。可以借助 tee 命令:
echo "core.%e.%p.%t" | sudo tee /proc/sys/kernel/core_pattern2.2 编译运行
gcc 001-segmentation-fault.c有如下输出:
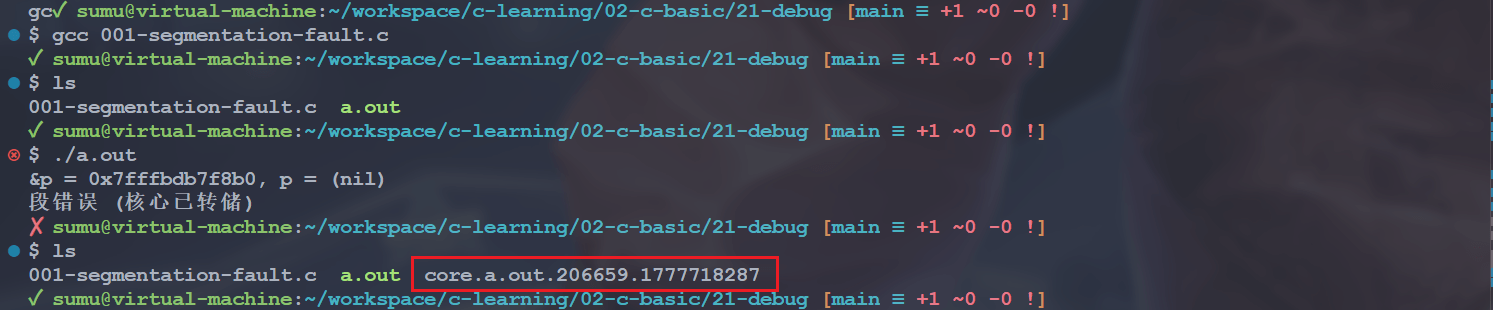
可以看到生成了 core.a.out.206659.1777718287 文件。
2.3 core.%e.%p.%t 内容
这个文件其实是一个二进制文件,我们无法直接查看,需要用 gdb 命令转成可阅读的形式:
gdb -c coredump_file -batch -ex "bt" -ex "info registers" -ex "info threads"参数说明如下:
| 参数 | 含义 |
|---|---|
gdb | GNU 调试器,用于分析程序崩溃 |
-c core.a.out.206659.1777718287 | 指定要分析的 coredump 文件(-c 表示 core file) |
-batch | 批处理模式,执行完命令后自动退出,不进入交互界面 |
-ex "bt" | 执行命令 bt(backtrace),显示函数调用栈 |
-ex "info registers" | 执行命令显示 CPU 寄存器状态 |
-ex "info threads" | 执行命令显示线程信息 |
会有如下输出信息:
✓ sumu@virtual-machine:~/workspace/c-learning [main ≡ +1 ~0 -0 !]
$ cd 02-c-basic/21-debug && gdb -c core.a.out.206659.1777718287 -batch -ex "bt" -ex "info registers" -ex "info threads"
[New LWP 206659]
Core was generated by `./a.out'.
Program terminated with signal SIGSEGV, Segmentation fault.
#0  0x000056242eb911b3 in ?? ()
#0  0x000056242eb911b3 in ?? ()
#1  0x00007fffbdb7f9b8 in ?? ()
#2  0x000000012eb91080 in ?? ()
#3  0x0000000000000000 in ?? ()
rax            0x0                 0
rbx            0x56242eb911f0      94713402692080
rcx            0x0                 0
rdx            0x0                 0
rsi            0x562439d362a0      94713588966048
rdi            0x7f552a26c7e0      140003756132320
rbp            0x7fffbdb7f8c0      0x7fffbdb7f8c0
rsp            0x7fffbdb7f8a0      0x7fffbdb7f8a0
r8             0x0                 0
r9             0x1f                31
r10            0x56242eb92013      94713402695699
r11            0x246               582
r12            0x56242eb91080      94713402691712
r13            0x7fffbdb7f9b0      140736376338864
r14            0x0                 0
r15            0x0                 0
rip            0x56242eb911b3      0x56242eb911b3
eflags         0x10202             [ IF RF ]
cs             0x33                51
ss             0x2b                43
ds             0x0                 0
es             0x0                 0
fs             0x0                 0
gs             0x0                 0
  Id   Target Id         Frame
* 1 LWP 206659 0x000056242eb911b3 in ?? ()2.4 源代码行号?
coredump 是可以看到源代码行号的,这个需要在编译的时候添加 -g 选项,并且执行可执行程序时要添加可执行文件名:
gcc -g src.c -o target.out
gdb ./target.out -c coredump_file -batch -ex "bt" -ex "info registers"我们重新编译并执行上面的测试程序,产生 coredump 文件,然后使用上面的命令解析可得:
✓ sumu@virtual-machine:~/workspace/c-learning [main ≡ +1 ~0 -0 !]
$ cd 02-c-basic/21-debug && gdb ./a.out -c core.a.out.207832.1777719137 -batch -ex "bt" -ex "info registers"
[New LWP 207832]
Core was generated by `./a.out'.
Program terminated with signal SIGSEGV, Segmentation fault.
#0  main (argc = 1, argv = 0x7ffc16a1c848) at 001-segmentation-fault.c: 7
7           *p = 5;
#0  main (argc = 1, argv = 0x7ffc16a1c848) at 001-segmentation-fault.c: 7
rax            0x0                 0
rbx 0x555906c531f0 93840854036976其中第 7 行就是 *p = 5;,这里 p 是指向 NULL 的,并不是一个合法地址,所以直接崩溃了。
3. Lubancat2 开发板测试
我们在开发板上再试一次,在开发板中我们创建配置文件来测试。Lubancat2 开发板的出厂系统默认 coredump 也是未开启的:
root@lubancat:~# ulimit -c
03.1 /etc/sysctl.d/*.conf
我们创建 /etc/sysctl.d/core_dump.conf,并添加以下内容:
# 指定 core 文件存放路径和命名格式:core.%e.%p.%t → core.可执行文件名.pid.转储unix时间
kernel.core_pattern = core.%e.%p.%t

# 是否在 core 文件名后自动追加 .PID(当 core_pattern 不含 %p 时生效)
kernel.core_uses_pid = 1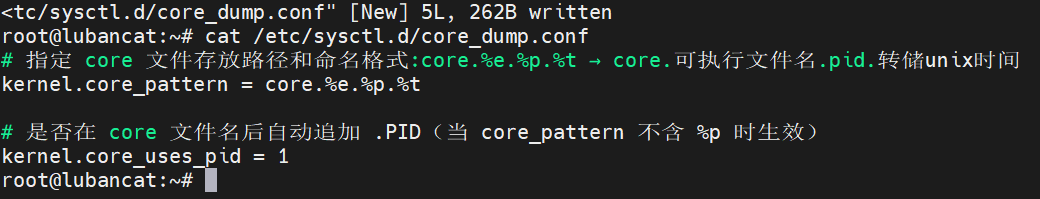
然后执行以下命令:
sysctl -p /etc/sysctl.d/core_dump.conf
sysctl kernel.core_pattern
sysctl kernel.core_uses_pid
sysctl -a | grep "kernel.core_pattern"将会看到如下输出:
root@lubancat:~# sysctl -p /etc/sysctl.d/core_dump.conf
kernel.core_pattern = core.%e.%p.%t
kernel.core_uses_pid = 1

root@lubancat:~# sysctl kernel.core_pattern
kernel.core_pattern = core.%e.%p.%t

root@lubancat:~# sysctl kernel.core_uses_pid
kernel.core_uses_pid = 1

root@lubancat:~# sysctl -a | grep "kernel.core_pattern"
kernel.core_pattern = core.%e.%p.%t3.2 开启 coredump
# 不限制产生 core 的大小
ulimit -c unlimited3.3 交叉编译并运行
在 ubuntu 中交叉编译,当然,要是开发板安装了 gcc,也可以直接在开发板编译。
export PATH=$PATH:/home/sumu/workspace/cnb-lubancat/prebuilts/gcc/linux-x86/aarch64/gcc-arm-10.3-2021.07-x86_64-aarch64-none-linux-gnu/bin

aarch64-none-linux-gnu-gcc -g 001-segmentation-fault.c

cp a.out ~/4nfs/c-learning然后在开发板挂载 nfs 目录并执行:
root@lubancat:~# mkdir -p ~/nfs_temp
root@lubancat:~# mount -t nfs -o nolock, nfsvers = 3 192.168.16.101:/home/sumu/4nfs ~/nfs_temp
root@lubancat:~# cd ~/nfs_temp/c-learning
root@lubancat:~# ulimit -c unlimited
root@lubancat:~# ./a.out然后就会生成对应的文件啦:
root@lubancat:~/nfs_temp/c-leaning# ./a.out
&p = 0x7fc49ebf78, p = (nil)
Segmentation fault (core dumped)
root@lubancat:~/nfs_temp/c-leaning# ls
a.out core.a.out.2000.17777204153.4 coredump 解析
我们还是需要使用 gdb 工具来解析 coredump 文件,要是开发板没装 gdb 的话,可以拷贝到 Ubuntu 编译服务器进行解析,我们来试一下。因为我们是直接挂载的,所以这里可以直接进入对应的目录使用 gdb:
cd ~/4nfs/c-learning
gdb core.a.out.2000.1777720415 -c coredump_file -batch -ex "bt" -ex "info registers"然后会看到这样的打印信息:
✗ sumu@virtual-machine:~/4nfs/c-leaning $ sudo gdb a.out -c core.a.out.2000.1777720415 -batch -ex "bt" -ex "info registers"
[sudo] sumu 的密码:

warning: Couldn't find general-purpose registers in core file.

warning: Unexpected size of section `.reg2' in core file.
Cannot access memory at address 0xbc0731dc
Cannot access memory at address 0xbc0731d8
Core was generated by `./a.out'.

warning: Couldn't find general-purpose registers in core file.

warning: Unexpected size of section `.reg2' in core file.
#0  <unavailable> in ?? ()
#0  <unavailable> in ?? ()
Backtrace stopped: not enough registers or memory available to unwind further
eax            <unavailable>
ecx            <unavailable>
edx            <unavailable>
ebx <unavailable>常见的一些错误:
| 错误信息 | 原因 |
|---|---|
Unexpected size of section '.reg2' | 寄存器格式不匹配(架构不同) |
Couldn't find general-purpose registers | GDB 无法识别目标架构的寄存器 |
<unavailable> in ?? | 无法读取寄存器和内存信息 |
发现什么都没有。因为 Ubuntu 的 gdb 是 x86_64 版本,无法正确解析 ARM64 架构生成的 coredump 文件。我们可用
# sudo 会重置环境变量,可能不生效
#export PATH =$PATH:/home/sumu/workspace/cnb-lubancat/prebuilts/gcc/linux-x86/aarch64/gcc-arm-10.3-2021.07-x86_64-aarch64-none-linux-gnu/bin

sudo /home/sumu/workspace/cnb-lubancat/prebuilts/gcc/linux-x86/aarch64/gcc-arm-10.3-2021.07-x86_64-aarch64-none-linux-gnu/bin/aarch64-none-linux-gnu-gdb \
./a.out -c core.a.out.2000.1777720415 -batch -ex "bt" -ex "info registers"然后就会得到下面的打印信息:
✗ sumu@virtual-machine:~/4nfs/c-leaning $ sudo /home/sumu/workspace/cnb-lubancat/prebuilts/gcc/linux-x86/aarch64/gcc-arm-10.3-2021.07-x86_64-aarch64-none-linux-gnu/bin/aarch64-none-linux-gnu-gdb \
>     ./a.out -c core.a.out.2000.1777720415 -batch -ex "bt" -ex "info registers"

warning: Can't open file /root/nfs_temp/c-leaning/a.out during file-backed mapping note processing

warning: Can't open file /usr/lib/aarch64-linux-gnu/libc.so.6 during file-backed mapping note processing

warning: Can't open file /usr/lib/aarch64-linux-gnu/ld-linux-aarch64.so.1 during file-backed mapping note processing
[New LWP 2000]

warning: .dynamic section for "/home/sumu/workspace/cnb-lubancat/prebuilts/gcc/linux-x86/aarch64/gcc-arm-10.3-2021.07-x86_64-aarch64-none-linux-gnu/aarch64-none-linux-gnu/libc/lib/ld-linux-aarch64.so.1" is not at the expected address (wrong library or version mismatch?)

warning: Could not load shared library symbols for /lib/aarch64-linux-gnu/libc.so.6.
Do you need "set solib-search-path" or "set sysroot"?
Core was generated by `./a.out'.
Program terminated with signal SIGSEGV, Segmentation fault.
#0  0x000000000040060c in main (argc = 1, argv = 0x7fc49ec0f8) at 001-segmentation-fault.c: 7
7           *p = 5;
#0  0x000000000040060c in main (argc = 1, argv = 0x7fc49ec0f8) at 001-segmentation-fault.c: 7
x0             0x0                 0
x1             0x5                 5
x2             0x0                 0
x3             0x0                 0
x4             0x400700            4196096
x5             0x3af842bd          989348541
x6             0xa                 10
x7             0x5                 5
x8             0x40                64
x9             0x7fbbfb3e40        548614651456
x10            0xa                 10
x11            0x0                 0
x12            0x3d                61
x13            0x34e6b4            3466932
x14            0x0                 0
x15            0x3                 3
x16            0x1                 1
x17            0x7fbc044430        548615242800
x18            0x19c000            1687552
x19            0x7fc49ec0f8        548759585016
x20            0x1                 1
x21            0x400640            4195904
x22            0x4005d4            4195796
x23            0x7fc49ec108        548759585032
x24            0x7fbc071ba0        548615429024
x25            0x0                 0
x26            0x7fbc072028        548615430184
x27            0x0                 0
x28            0x0                 0
x29            0x7fc49ebf50        548759584592
x30            0x400604            4195844
sp             0x7fc49ebf50        0x7fc49ebf50
pc             0x40060c            0x40060c <main+56>
cpsr           0x60001000          [ EL=0 SSBS C Z ]
fpsr           0x0                 0
fpcr 0x0 0会发现也打印出了崩溃对应的行号。发现这里有些警告,这些警告表示 GDB 无法找到 coredump 中记录的依赖文件:
| 警告 | 原因 | 影响 |
|---|---|---|
Can't open file /root/nfs_temp/c-leaning/a.out | coredump 记录的是开发板上的绝对路径,Ubuntu 上路径不同 | 可能影响源码定位 |
Can't open file /usr/lib/aarch64-linux-gnu/libc.so.6 | ARM64 的 C 库在 x86_64 Ubuntu 上不存在 | 无法调试 libc 函数 |
Can't open file /usr/lib/aarch64-linux-gnu/ld-linux-aarch64.so.1 | ARM64 动态链接器在 x86_64 Ubuntu 上不存在 | 无法分析动态链接问题 |
这个没办法,因为我们是在 ubuntu 中解析的,要是在开发板中使用 arm-gdb 来解析应该就没问题了。例如前面我交叉编译过 gdb,这里就可以用一下:
./arm-aarch64-none-linux-gnu-gdb ./a.out -c core.a.out.2000.1777720415 -batch -ex "bt" -ex "info registers"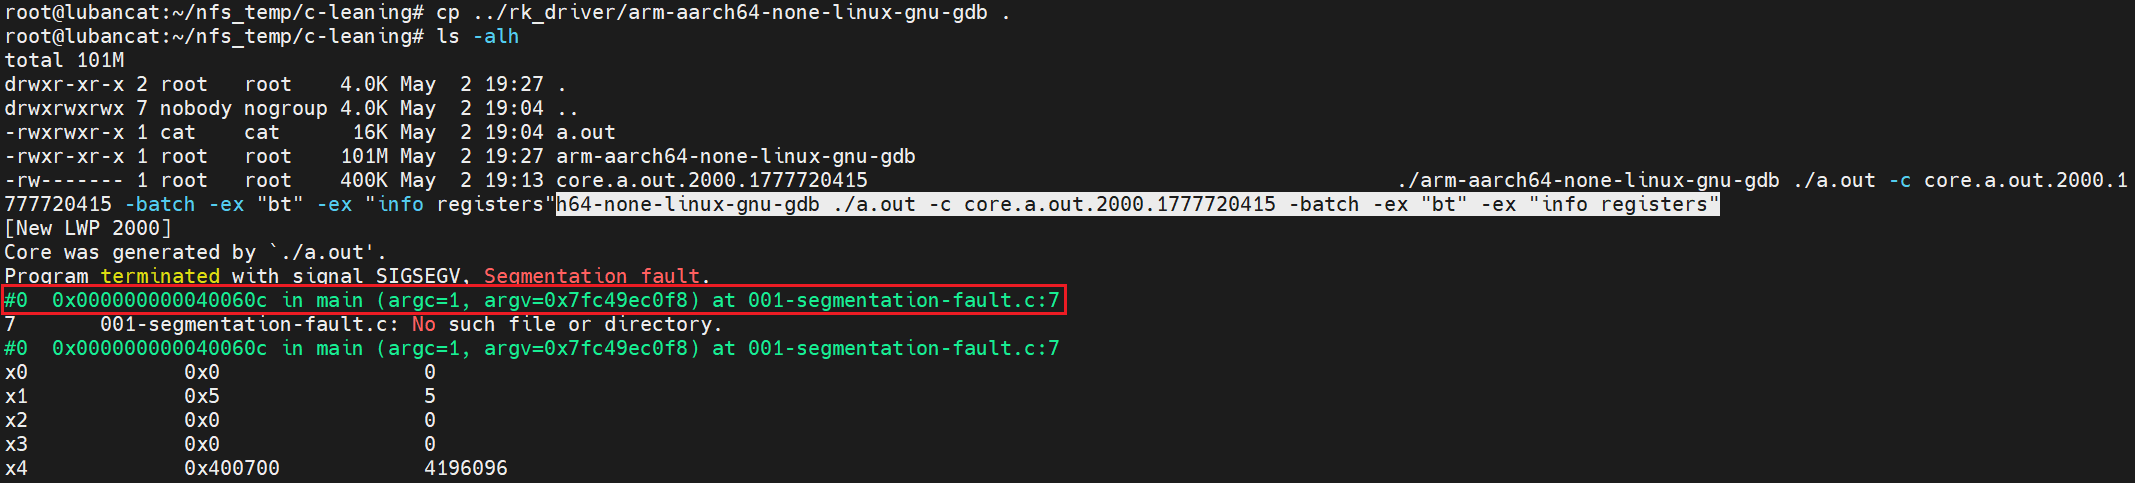
4. 源代码内容
从上面可以看出我们在 ubuntu 中解析 coredump 文件的时候,设置直接打印出了崩溃行的内容,但是在开发板中就没有,这是因为 GDB 需要找到源代码文件来显示具体的代码内容。
源文件路径是编译时嵌入的 绝对路径,不是相对路径。Ubuntu 上恰好有这个源文件,所以 GDB 能找到并显示代码内容。我们在 ubuntu 中执行以下命令,通过 readelf 查看调试信息,就会发现编译时记录了 绝对路径:
readelf --debug-dump=info ./a.out 2>/dev/null | grep -E "001-segmentation-fault" -A2 -B2有如下打印信息:
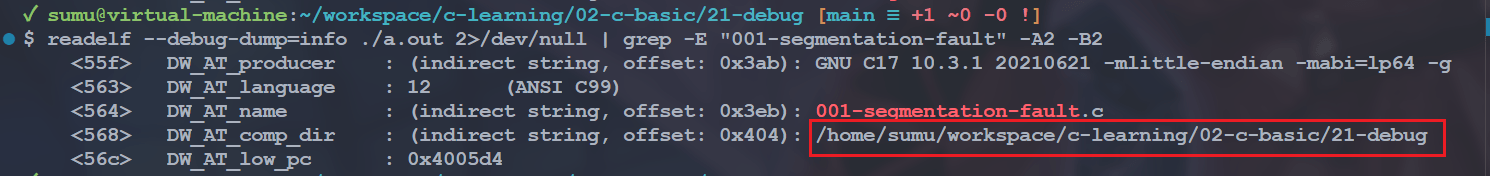
GDB 会将 DW_AT_comp_dir + / + DW_AT_name 拼接成完整路径:
/home/sumu/workspace/c-learning/02-c-basic/21-debug/001-segmentation-fault.c开发板上肯定没有这个路径,所以显示 No such file or directory。
二、C 程序设置 coredump
1. 怎么设置?
我们也可以在程序中设置 coredump,其实就是使用 open 函数打开 /proc/sys/kernel/ 中的 core_pattern 和 core_uses_pid 文件,然后写入对应的内容即可。这两个好说,还有一个开启 coredump 的操作,我们可以使用 getrlimit 和 setrlimit 函数。
1.1 struct rlimit 结构体
struct rlimit 结构体定义在 <sys/resource.h> 中:
struct rlimit {
    rlim_t rlim_cur;  /* 软限制:当前限制值 */
    rlim_t rlim_max;  /* 硬限制:最大限制值 */
};【字段说明】
rlim_cur:软限制(soft limit),是内核实际执行的限制值,进程可以随时修改,但不能超过硬限制rlim_max:硬限制(hard limit),是软限制的上限,普通用户只能降低硬限制,只有特权用户(如 root)才能提高硬限制
【特殊值】
RLIM_INFINITY:表示无限制,通常用于表示该资源不受限制
1.2 getrlimit()
该函数在 <sys/resource.h> 头文件中声明:
int getrlimit(int resource, struct rlimit *rlim);【函数作用】该函数用于获取指定资源类型的当前限制值和最大限制值。
【参数含义】
resource:指定要查询的资源类型,常用值包括:
| 资源类型 | 说明 |
|---|---|
RLIMIT_CORE | core dump 文件的最大大小(字节) |
RLIMIT_CPU | CPU 时间限制(秒) |
RLIMIT_DATA | 数据段的最大大小(字节) |
RLIMIT_FSIZE | 创建文件的最大大小(字节) |
RLIMIT_NOFILE | 打开文件描述符的最大数量 |
RLIMIT_STACK | 栈的最大大小(字节) |
RLIMIT_AS | 进程地址空间的最大大小(字节) |
rlim:指向struct rlimit结构体的指针,用于存储获取到的资源限制信息
【返回值】成功返回 0,失败返回 -1 并设置 errno
1.3 setrlimit()
该函数在 <sys/resource.h> 头文件中声明:
int setrlimit(int resource, const struct rlimit *rlim);【函数作用】该函数用于设置指定资源类型的限制值。
【参数含义】
resource:指定要设置的资源配置,取值与getrlimit()相同rlim:指向struct rlimit结构体的指针,包含要设置的限制值
【返回值】成功返回 0,失败返回 -1 并设置 errno
2. 测试程序
#include <stdio.h>
#include <unistd.h>
#include <string.h>
#include <sys/types.h>
#include <sys/stat.h>
#include <fcntl.h>
#include <sys/resource.h>

int sys_open_coredump(char *pCorePid, char *pCorePath) {
    int           iRet = -1;
    int           iFd1 = -1;
    int           iFd2 = -1;
    struct rlimit limit = {0};
    struct rlimit limit_set = {0};

    /* 1. set core ulimit, ulimit -c coredump_size */
    if (getrlimit(RLIMIT_CORE, &limit)) {
        printf("[error]get resource limit fail!\n");
        return -1;
    }

    limit_set.rlim_cur = RLIM_INFINITY;
    limit_set.rlim_max = RLIM_INFINITY;
    if (setrlimit(RLIMIT_CORE, &limit_set)) {
        limit_set.rlim_cur = limit_set.rlim_max = limit.rlim_max;
        if (limit.rlim_max != RLIM_INFINITY) {
            // printf( "CORE: cur = 0x%x, max = 0x%x\n",
            // limit.rlim_cur, limit.rlim_max);
        }
        if (setrlimit(RLIMIT_CORE, &limit_set)) {
            printf("[error]set core ulimited fail!\n");
            return -1;
        }
    }

    /* 2. set core use pid */
    if (pCorePid && strlen(pCorePid) > 0) {
        iFd1 = open("/proc/sys/kernel/core_uses_pid", O_RDWR | O_NDELAY | O_TRUNC, 0);
        if (iFd1 < 0) {
            printf("[error]open core_uses_pid fail!\n");
            return -1;
        }
        if (strlen(pCorePid) != write(iFd1, pCorePid, strlen(pCorePid))) {
            printf("[error]set core_uses_pid fail!\n");
            close(iFd1);
            return -1;
        }
        close(iFd1);
    }

    /* 3. set core pattern */
    if (pCorePath && strlen(pCorePath) > 0) {
        iFd2 = open("/proc/sys/kernel/core_pattern", O_RDWR | O_NDELAY | O_TRUNC, 0);
        if (iFd2 < 0) {
            printf("[error]open core_pattern fail!\n");
            return -1;
        }
        if (strlen(pCorePath) != write(iFd2, pCorePath, strlen(pCorePath))) {
            printf("[error]set core_pattern fail!\n");
            close(iFd2);
            return -1;
        }
        close(iFd2);
    }

    iRet = 0;
    printf("set core dump open success!\n");

    return 0;
}

void sys_init_coredump(void) {
    char stCorePid[32] = {0};
    char stCorePath[128] = {0};

    /* 为了唯一区分 core 文件, 默认值: 通常是 0,表示不包含 PID;如果设置为 1,则在 core dump 文件名中包含 PID */
    strcpy(stCorePid, "1");

    memset(stCorePath, 0, sizeof(stCorePath));

    /* core 保存目录 */
    strcpy(stCorePath, "./");

    if (access(stCorePath, F_OK) != 0) {
        printf("[error]Exception access stCorePath:%s is fail!\n", stCorePath);
        return;
    }

    /* core 文件名称: 包含 %e、%s、%p、%t 等占位符的字符串,
       这些占符会被替换为实际的程序名、信号编号、进程 PID 和 unix 时间戳等信息*/
    strcat(stCorePath, "core-%s-%e-%p-%t");

    if (0 != sys_open_coredump(stCorePid, stCorePath)) {
        printf("[error]========= gdb core dump open fail! =========\n\n");
    }
    else {
        printf("sys gdb core open success!!!\n");
    }
}

int main(int argc, const char *argv[]) {
    int *p = NULL;
    sys_init_coredump();
    printf("&p = %p, p = %p\n", &p, p);
    *p = 5;
    printf("*p=%d\n", *p);
    return 0;
}3. 编译运行
上面的程序,我们编译的时候可以带上-g 选项:
export PATH=$PATH:/home/sumu/workspace/cnb-lubancat/prebuilts/gcc/linux-x86/aarch64/gcc-arm-10.3-2021.07-x86_64-aarch64-none-linux-gnu/bin

aarch64-none-linux-gnu-gcc -g 002-set-coresump.c

cp a.out ~/4nfs/c-learning在运行的时候需要有 sudo 权限,不然 open 或者 write 的时候可能会失败。
三、线程实例
接下来我们在 Lubancat2 中写一个多线程实例,手动让线程产生崩溃。
1. 测试程序
#include <stdio.h>
#include <unistd.h>
#include <string.h>
#include <sys/types.h>
#include <sys/stat.h>
#include <fcntl.h>
#include <sys/resource.h>

#include <pthread.h>
#include <sys/prctl.h>

#include <signal.h>

int sys_open_coredump(char *pCorePid, char *pCorePath) {
    int           iRet = -1;
    int           iFd1 = -1;
    int           iFd2 = -1;
    struct rlimit limit = {0};
    struct rlimit limit_set = {0};

    /* 1. set core ulimit, ulimit -c coredump_size */
    if (getrlimit(RLIMIT_CORE, &limit)) {
        printf("[error]get resource limit fail!\n");
        return -1;
    }

    limit_set.rlim_cur = RLIM_INFINITY;
    limit_set.rlim_max = RLIM_INFINITY;
    if (setrlimit(RLIMIT_CORE, &limit_set)) {
        limit_set.rlim_cur = limit_set.rlim_max = limit.rlim_max;
        if (limit.rlim_max != RLIM_INFINITY) {
            // printf( "CORE: cur = 0x%x, max = 0x%x\n",
            // limit.rlim_cur, limit.rlim_max);
        }
        if (setrlimit(RLIMIT_CORE, &limit_set)) {
            printf("[error]set core ulimited fail!\n");
            return -1;
        }
    }

    /* 2. set core use pid */
    if (pCorePid && strlen(pCorePid) > 0) {
        iFd1 = open("/proc/sys/kernel/core_uses_pid", O_RDWR | O_NDELAY | O_TRUNC, 0);
        if (iFd1 < 0) {
            printf("[error]open core_uses_pid fail!\n");
            return -1;
        }
        if (strlen(pCorePid) != write(iFd1, pCorePid, strlen(pCorePid))) {
            printf("[error]set core_uses_pid fail!\n");
            close(iFd1);
            return -1;
        }
        close(iFd1);
    }

    /* 3. set core pattern */
    if (pCorePath && strlen(pCorePath) > 0) {
        iFd2 = open("/proc/sys/kernel/core_pattern", O_RDWR | O_NDELAY | O_TRUNC, 0);
        if (iFd2 < 0) {
            printf("[error]open core_pattern fail!\n");
            return -1;
        }
        if (strlen(pCorePath) != write(iFd2, pCorePath, strlen(pCorePath))) {
            printf("[error]set core_pattern fail!\n");
            close(iFd2);
            return -1;
        }
        close(iFd2);
    }

    iRet = 0;
    printf("set core dump open success!\n");

    return 0;
}

void sys_init_coredump(void) {
    char stCorePid[32] = {0};
    char stCorePath[128] = {0};

    /* 为了唯一区分 core 文件, 默认值: 通常是 0,表示不包含 PID;如果设置为 1,则在 core dump 文件名中包含 PID */
    strcpy(stCorePid, "1");

    memset(stCorePath, 0, sizeof(stCorePath));

    /* core 保存目录 */
    strcpy(stCorePath, "./");

    if (access(stCorePath, F_OK) != 0) {
        printf("[error]Exception access stCorePath:%s is fail!\n", stCorePath);
        return;
    }

    /* core 文件名称: 包含 %e、%s、%p、%t 等占位符的字符串,
       这些占符会被替换为实际的程序名、信号编号、进程 PID 和 unix 时间戳等信息*/
    strcat(stCorePath, "core-%s-%e-%p-%t");

    if (0 != sys_open_coredump(stCorePid, stCorePath)) {
        printf("[error]========= gdb core dump open fail! =========\n\n");
    }
    else {
        printf("sys gdb core open success!!!\n");
    }
}

static int coreDumpFlag = 0;

void *tsk_test1(void *arg) {
    int *p = NULL;
    char name[32] = {0};

    int       pid = getpid();       // 获取当前进程的 PID
    int       ppid = getppid();     // 获取当前进程的父进程 PID
    pthread_t tid = pthread_self(); // 获取当前线程的 ID

    snprintf(name, sizeof(name), "t%d", *(int *)arg);
    prctl(PR_SET_NAME, (unsigned long)name);

    printf("[%s:%d]pid=%d, ppid=%d, %s's tid=%lu\n", __FUNCTION__, __LINE__, pid, ppid, name, tid);
    printf("&p = %p, p = %p\n", &p, p);

    while (1) {
        sleep(1);
        if (coreDumpFlag) {
            *p = 5; // 这里将会产生崩溃
            printf("*p=%d\n", *p);
        }
    }
    return NULL;
}

void sigintHandle(int sig) {
    coreDumpFlag = 1;
    printf("I catch the SIGUSR1!coreDumpFlag=%d\n", coreDumpFlag);
}

int main(int argc, const char *argv[]) {
    int       arg = 2;
    pthread_t tid_child;

    int       pid = getpid();            // 获取当前进程的 PID
    int       ppid = getppid();          // 获取当前进程的父进程 PID
    pthread_t tid_main = pthread_self(); // 获取当前线程的 ID

    sys_init_coredump();
    signal(SIGUSR1, sigintHandle); // SIGUSR1--> 10

    printf("[%s:%d]pid=%d, ppid=%d, main's tid=%lu\n", __FUNCTION__, __LINE__, pid, ppid, tid_main);

    pthread_create(&tid_child, NULL, tsk_test1, &arg);
    pthread_join(tid_child, NULL);

    return 0;
}2. 编译运行
在 ubuntu 中交叉编译
export PATH=$PATH:/home/sumu/workspace/cnb-lubancat/prebuilts/gcc/linux-x86/aarch64/gcc-arm-10.3-2021.07-x86_64-aarch64-none-linux-gnu/bin

aarch64-none-linux-gnu-gcc -g 005-pthread-demo.c -lpthread

cp a.out ~/4nfs/c-learning在开发板中运行并查看进程和线程信息:
cd ~/nfs_temp/c-leaning
./a.out &
ps -T # 可以显示线程运行后我们可以看到如下打印信息:
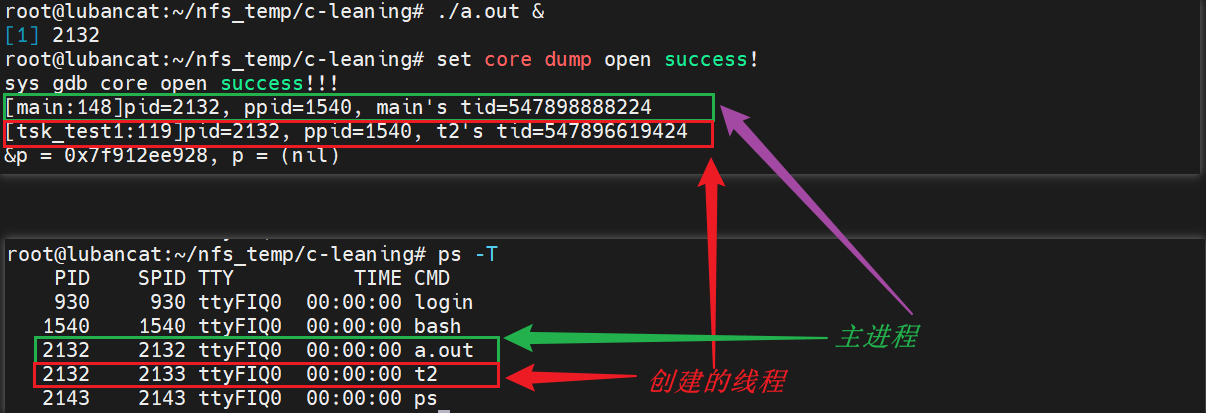
这里的 t2 就是我们创建的线程的线程名。
3. 发送信号
上面已经运行了,接下来向这个进程发送信号:
kill -10 2132然后就会产生崩溃并生成 coredump 文件:
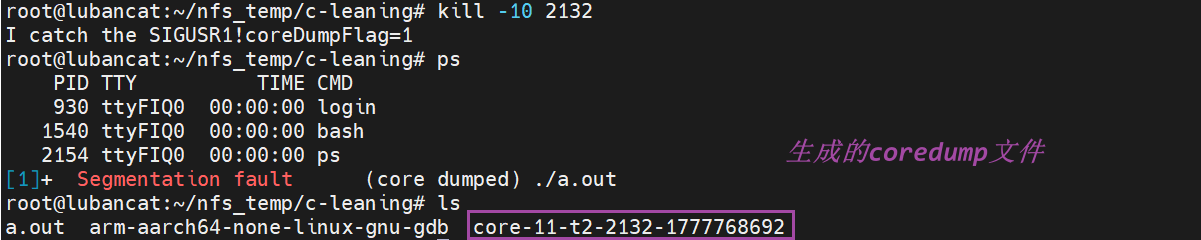
我们前面设置的 coredump 文件格式是 core-%s-%e-%p-%t, 即 core-信号编号-可执行程序名称-进程 PID-unix时间戳,由于我们使用 prctl 修改了线程名称,所以这里显示的可执行文件名是线程的名称。
Tips:为什么这里信号编号是 11?
kill -10 2132→ 发送信号 10 (SIGUSR1)信号处理函数
sigintHandle执行,打印I catch the SIGUSR1!coreDumpFlag=1,设置coreDumpFlag = 1线程
tsk_test1检测到coreDumpFlag == 1,执行*p = 5;由于
p = NULL,触发 段错误 (SIGSEGV,信号 11)coredump 文件名格式
core-%s-%e-%p-%t中%s是 导致崩溃的信号编号,所以生成core-11-...