
LV050-gdb和gdbserver调试嵌入式程序
Tips:本节所用的嵌入式开发板是野火的Lubancat2。
一、在 ARM 使用 GDB
前面我已经移植了 gdb 到开发板,来看一下在开发板调试会有什么问题.
1. 测试程序
#include <stdio.h>

int main(int argc, const char *argv[]) {
    int *p = NULL;

    printf("&p = %p, p = %p\n", &p, p);
    *p = 5;
    printf("*p=%d\n", *p);
    return 0;
}我们通过以下命令在 ubuntu 中交叉编译:
export PATH=$PATH:/home/sumu/workspace/cnb-lubancat/prebuilts/gcc/linux-x86/aarch64/gcc-arm-10.3-2021.07-x86_64-aarch64-none-linux-gnu/bin

aarch64-none-linux-gnu-gcc -g 001-segmentation-fault.c

cp a.out ~/4nfs/c-learning2. 使用 gdb
这里我使用前面自己移植的 gdb:
root@lubancat:~/nfs_temp/c-leaning# ./arm-aarch64-none-linux-gnu-gdb  ./a.out -q
Reading symbols from ./a.out...
(gdb) l
124 005-pthread-demo.c: No such file or directory.会发现可以启动 gdb 但是,我们无法通过 l 命令来查看源码,那怎么打断点?其实也是可以的,我们知道源码的第 6 行是打印,所以也可以直接打:
(gdb) b 6
Breakpoint 1 at 0x400c28: file 005-pthread-demo.c, line 15.
(gdb) b 7
Note: breakpoint 1 also set at pc 0x400c28.
Breakpoint 2 at 0x400c28: file 005-pthread-demo.c, line 15.
(gdb) info b
Num     Type           Disp Enb Address            What
1       breakpoint     keep y   0x0000000000400c28 in sys_open_coredump at 005-pthread-demo.c:15
2 breakpoint keep y 0x0000000000400c28 in sys_open_coredump at 005-pthread-demo.c:15然后可以运行到断点:
(gdb) r
Starting program: /root/nfs_temp/c-leaning/a.out

Breakpoint 1, main (argc=1, argv=0x7ffffff5e8) at 001-segmentation-fault.c:6
6       in 001-segmentation-fault.c
(gdb) n
&p = 0x7ffffff468, p = (nil)

Breakpoint 2, main (argc=1, argv=0x7ffffff5e8) at 001-segmentation-fault.c:7
7       in 001-segmentation-fault.c
(gdb) n

Program received signal SIGSEGV, Segmentation fault.
0x000000000040060c in main (argc=1, argv=0x7ffffff5e8) at 001-segmentation-fault.c:7
7       in 001-segmentation-fault.c
(gdb)这样做也可以调试,只是无法看到源代码,打断点需要看源码。下一行要执行什么?这些都不是很方便。而且对于芯片性能不够的,直接用 gdb 可能跑不起来。
二、gdb+gdbserver
1. 网络远程调试
1.1 确定 IP
我们要确定开发板和调试机(ubuntu)网络是可以互相 ping 通的:
- ubuntu
$ ip addr show ens37
3: ens37: <BROADCAST,MULTICAST,UP,LOWER_UP> mtu 1500 qdisc fq_codel state UP group default qlen 1000
    link/ether 00:0c:29:ef:13:cb brd ff:ff:ff:ff:ff:ff
    altname enp2s5
    inet 192.168.16.101/24 brd 192.168.16.255 scope global noprefixroute ens37
valid_lft forever preferred_lft forever- 开发板
root@lubancat:~/nfs_temp/c-leaning# ifconfig
eth0: flags=4163<UP,BROADCAST,RUNNING,MULTICAST>  mtu 1500
        inet 192.168.16.103  netmask 255.255.255.0  broadcast 192.168.16.255
        ether 4e:76:74:5a:43:0e  txqueuelen 1000  (Ethernet)
        RX packets 21553  bytes 29146942 (27.7 MiB)
        RX errors 0  dropped 0  overruns 0  frame 0
        TX packets 11009  bytes 922666 (901.0 KiB)
        TX errors 0  dropped 0 overruns 0  carrier 0  collisions 0
device interrupt 50这里我连接了网口到 windows,并且 windows、ubuntu 和开发板处于同一网段,可以互相 ping 通。
1.2 启动 gdbserver
cd /root/nfs_temp/c-leaning
./arm-aarch64-none-linux-gnu-gdbserver 192.168.16.101:2001 a.out # 启动开发板上的 gdbserver上述命令中 192.168.16.101 为调试机的 IP 地址,也就是 ubuntu 的 IP 地址, 2001 是端口号,可以任意给一个端口号, a.out 是要调试的可执行文件。会看到如下打印信息:
root@lubancat:~/nfs_temp/c-leaning# ls
a.out  arm-aarch64-none-linux-gnu-gdb  arm-aarch64-none-linux-gnu-gdbserver
root@lubancat:~/nfs_temp/c-leaning# ./arm-aarch64-none-linux-gnu-gdbserver 192.168.16.101:2001 a.out
Process /root/nfs_temp/c-leaning/a.out created; pid = 1785
Listening on port 20011.3 启动 arm-pc-gdb
我们在 ubuntu 中启动 gdb:
cd ~/workspace/cnb-lubancat/gdb-10.2/build-pc/_install/bin
./arm-pc-aarch64-none-linux-gnu-gdb -q
(gdb) target remote 192.168.16.103:2001我们会看到如下打印信息:
✓ sumu@virtual-machine:~/workspace/cnb-lubancat/gdb-10.2/build-pc/_install/bin
$ ./arm-pc-aarch64-none-linux-gnu-gdb -q
(gdb) target remote 192.168.16.103:2001
Remote debugging using 192.168.16.103:2001
Reading /root/nfs_temp/c-leaning/a.out from remote target...
warning: File transfers from remote targets can be slow. Use "set sysroot" to access files locally instead.
Reading /root/nfs_temp/c-leaning/a.out from remote target...
Reading symbols from target:/root/nfs_temp/c-leaning/a.out...
Reading /lib/ld-linux-aarch64.so.1 from remote target...
Reading /lib/ld-linux-aarch64.so.1 from remote target...
Reading symbols from target:/lib/ld-linux-aarch64.so.1...
Reading /lib/ca2815b2d47fbfef89c8abe8453e1f1c77dfa3.debug from remote target...
Reading /lib/.debug/ca2815b2d47fbfef89c8abe8453e1f1c77dfa3.debug from remote target...
Reading /home/sumu/workspace/cnb-lubancat/gdb-10.2/build-pc/_install/lib/debug//lib/ca2815b2d47fbfef89c8abe8453e1f1c77dfa3.debug from remote target...
Reading /home/sumu/workspace/cnb-lubancat/gdb-10.2/build-pc/_install/lib/debug/lib//ca2815b2d47fbfef89c8abe8453e1f1c77dfa3.debug from remote target...
Reading target:/home/sumu/workspace/cnb-lubancat/gdb-10.2/build-pc/_install/lib/debug/lib//ca2815b2d47fbfef89c8abe8453e1f1c77dfa3.debug from remote target...
(No debugging symbols found in target:/lib/ld-linux-aarch64.so.1)
0x0000007ff7fd8d00 in ?? () from target:/lib/ld-linux-aarch64.so.1在开发板端会看到:
root@lubancat:~/nfs_temp/c-leaning# ./arm-aarch64-none-linux-gnu-gdbserver 192.168.16.101:2001 a.out
Process /root/nfs_temp/c-leaning/a.out created; pid = 1641
Listening on port 2001
Remote debugging from host 192.168.16.101, port 47296 # <== 这里表示连接成功1.4 调试命令
使用 gdbserver + gdb 远程调试时:
(1)gdbserver 已经启动了程序(在开发板上),所以不支持 run 命令,会报 The "remote" target does not support "run". Try "help target" or "continue".
(2)gdb 连接后程序处于暂停状态。
(3)使用 continue(不是 run)继续执行程序
打断点然后执行的示例如下:
✓ sumu@virtual-machine:~/workspace/cnb-lubancat/gdb-10.2/build-pc/_install/bin
$ ./arm-pc-aarch64-none-linux-gnu-gdb -q
(gdb) target remote 192.168.16.103:2001
Remote debugging using 192.168.16.103:2001
Reading /root/nfs_temp/c-leaning/a.out from remote target...
warning: File transfers from remote targets can be slow. Use "set sysroot" to access files locally instead.
Reading /root/nfs_temp/c-leaning/a.out from remote target...
Reading symbols from target:/root/nfs_temp/c-leaning/a.out...
Reading /lib/ld-linux-aarch64.so.1 from remote target...
Reading /lib/ld-linux-aarch64.so.1 from remote target...
Reading symbols from target:/lib/ld-linux-aarch64.so.1...
Reading /lib/ca2815b2d47fbfef89c8abe8453e1f1c77dfa3.debug from remote target...
Reading /lib/.debug/ca2815b2d47fbfef89c8abe8453e1f1c77dfa3.debug from remote target...
Reading /home/sumu/workspace/cnb-lubancat/gdb-10.2/build-pc/_install/lib/debug//lib/ca2815b2d47fbfef89c8abe8453e1f1c77dfa3.debug from remote target...
Reading /home/sumu/workspace/cnb-lubancat/gdb-10.2/build-pc/_install/lib/debug/lib//ca2815b2d47fbfef89c8abe8453e1f1c77dfa3.debug from remote target...
Reading target:/home/sumu/workspace/cnb-lubancat/gdb-10.2/build-pc/_install/lib/debug/lib//ca2815b2d47fbfef89c8abe8453e1f1c77dfa3.debug from remote target...
(No debugging symbols found in target:/lib/ld-linux-aarch64.so.1)
0x0000007ff7fd8d00 in ?? () from target:/lib/ld-linux-aarch64.so.1
(gdb) l
1       #include <stdio.h>
2
3       int main(int argc, const char *argv[]) {
4           int *p = NULL;
5
6           printf("&p = %p, p = %p\n", &p, p);
7           *p = 5;
8           printf("*p=%d\n", *p);
9           return 0;
10      }
(gdb) b 6
Breakpoint 1 at 0x4005e8: file 001-segmentation-fault.c, line 6.
(gdb) b 7
Breakpoint 2 at 0x400604: file 001-segmentation-fault.c, line 7.
(gdb) c
Continuing.
Reading /lib/aarch64-linux-gnu/libc.so.6 from remote target...
Reading /lib/aarch64-linux-gnu/f3f95a1642952473d0d5739aaf308b0e24f694.debug from remote target...
Reading /lib/aarch64-linux-gnu/.debug/f3f95a1642952473d0d5739aaf308b0e24f694.debug from remote target...
Reading /home/sumu/workspace/cnb-lubancat/gdb-10.2/build-pc/_install/lib/debug//lib/aarch64-linux-gnu/f3f95a1642952473d0d5739aaf308b0e24f694.debug from remote target...
Reading /home/sumu/workspace/cnb-lubancat/gdb-10.2/build-pc/_install/lib/debug/lib/aarch64-linux-gnu//f3f95a1642952473d0d5739aaf308b0e24f694.debug from remote target...
Reading target:/home/sumu/workspace/cnb-lubancat/gdb-10.2/build-pc/_install/lib/debug/lib/aarch64-linux-gnu//f3f95a1642952473d0d5739aaf308b0e24f694.debug from remote target...

Breakpoint 1, main (argc=1, argv=0x7ffffff608) at 001-segmentation-fault.c:6
6           printf("&p = %p, p = %p\n", &p, p);
(gdb) n

Breakpoint 2, main (argc=1, argv=0x7ffffff608) at 001-segmentation-fault.c:7
7           *p = 5;
(gdb) n

Program received signal SIGSEGV, Segmentation fault.
0x000000000040060c in main (argc=1, argv=0x7ffffff608) at 001-segmentation-fault.c:7
7           *p = 5;
(gdb) n

Program terminated with signal SIGSEGV, Segmentation fault.
The program no longer exists.1.5 退出调试
在开发板端,按下 Ctrl+c 好像也无法退出调试:

当 gdbserver 处于 "Listening on port" 状态等待连接时,它可能不会响应 Ctrl+C 信号。所以我们要不就是启动的时候直接放后台,要不就是重开一个终端,直接 kill 它。或者等客户端连上后,客户端退出的时候,开发板的 gdbserver 也会停止。 客户端的 gdb 就正常按下 q 就可退出了。
1.6 通过 gdbserver 挂接到已运行程序
如果 a.ouy 已经运行,可以通过 attach 方式启动 gdbserver,挂接到 a.out 程序进行调试。先在 ARM 开发板启动可执行程序,然后通过 ps 命令找到进程的 pid,通过下面的命令挂接到对应进程:
gdbserver --attach debug_machine_ip:port pid我后来写了一个可放在后台运行的程序 b.out ,执行了上面的 gdbserver 命令的输出信息如下:
root@lubancat:~/nfs_temp/c-leaning# ./b.out &
[1] 1800
Hello, World!

root@lubancat:~/nfs_temp/c-leaning# ps
    PID TTY          TIME CMD
    929 ttyFIQ0  00:00:00 login
   1728 ttyFIQ0  00:00:00 bash
   1800 ttyFIQ0  00:00:00 b.out
   1801 ttyFIQ0  00:00:00 ps

root@lubancat:~/nfs_temp/c-leaning# ./arm-aarch64-none-linux-gnu-gdbserver --attach 192.168.16.101:2001 1800
Attached; pid = 1800
Listening on port 2001ubuntu 端和前面一样的命令。
2. 通过串口远程调试
那没有网口连接怎么办?我们还可以通过串口进行。这里的实践是我用野火的Lubancat2进行的,但是后面因为串口有些地方还没搞懂,就没继续进行下去,后续再补充。
2.1 VMware 与ubuntu
2.1.1 添加串行端口
我们需要关闭 ubuntu 虚拟机,然后【虚拟机设置】→【添加】→【串行端口】→【选择使用物理串行端口】→【COM4】
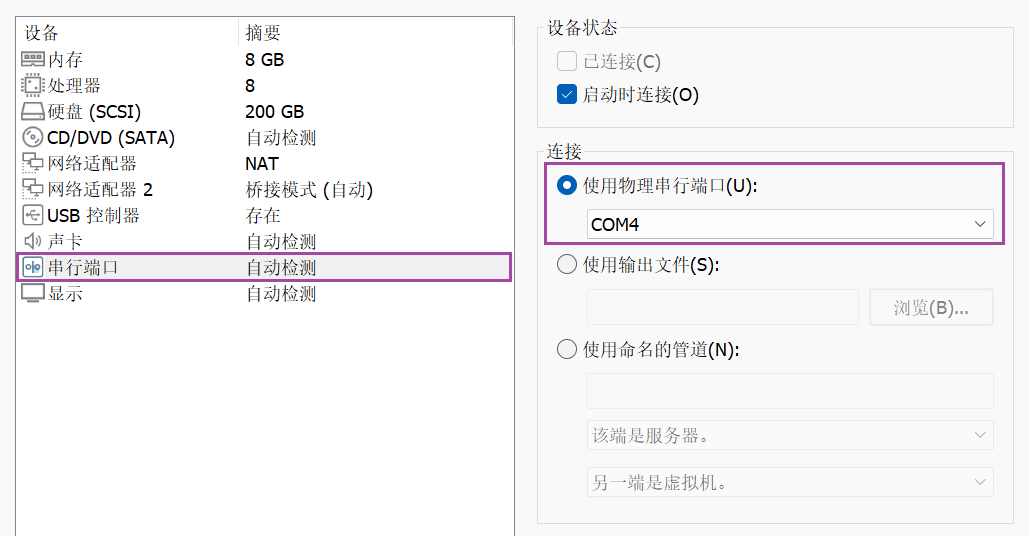
具体是 COM 多少,可以拔插一下串口,然后看 windows 下的设备管理哪个会消失和出现,可以【win+r】→【运行框输入 devmgmt.msc】→【端口(COM 和 LPT)】。这样操作后,mobaxterm 应该就无法连接到串口了,因为启动虚拟机的时候串口会连接到虚拟机中。

2.1.2 连接串口
要是没有自动连接到虚拟机内部的话,可以【虚拟机】→【可移动设备】→【串行端口】→【连接/断开连接】,串口连接后图标下侧会出现一个小绿点,断开时没有小绿点。鼠标移动到这个图标上,会显示“串行端口:正在使用端口 COM4。

怎么确认连接串口到 ubuntu 后用的是哪个设备节点?虚拟机里的串口设备节点是系统启动时就创建好的,拔插操作只是改变了它的连接状态,节点本身并不会消失或新增,所以用 ls 命令看不出变化。vmware的串口命名一般是:

我们可以在ubuntu的dmesg中搜索一些tty相关的信息:
dmesg | grep "tty*"一开始会看到下面的打印信息:
[    1.298397] Console: colour VGA+ 80x25
[ 1.298419] printk: console [tty0] enabled这个表示内核已经启用了 tty0 作为系统控制台 —— 即系统虚拟终端(通常是屏幕上的第一个文本控制台)已经准备好接收内核输出的打印信息(如启动日志、调试信息、错误警告等)。
然后会看到这样的打印:
[    6.280930] Serial: 8250/16550 driver, 32 ports, IRQ sharing enabled
[ 6.372486] 00:05: ttyS0 at I/O 0x3f8 (irq = 4, base_baud = 115200) is a 16550A内核激活了 8250/16550 系列串口驱动,这是 PC 上最常见的串口控制器驱动。32 ports:驱动最多支持 32 个串口设备(逻辑上的最大数量,不是实际检测到的)。下面1行表示内核实际发现了一个串口设备,并把它注册为 ttyS0(Linux 中第一个串口的标准名称,对应 DOS/Windows 下的 COM1)。base_baud = 115200:参考波特率基准值,通常用于计算实际波特率(除以分频系数)。
2.1.3 查看串口信息
stty -F /dev/ttyFIQ0 -a # 查看当前串口参数在这里就是:
✗ sumu@virtual-machine:~
$ sudo stty -F /dev/ttyS0 -a
[sudo] sumu 的密码:
speed 9600 baud; rows 0; columns 0; line = 0;
intr = ^C; quit = ^\; erase = ^?; kill = ^U; eof = ^D; eol = <undef>; eol2 = <undef>;
swtch = <undef>; start = ^Q; stop = ^S; susp = ^Z; rprnt = ^R; werase = ^W;
lnext = ^V; discard = ^O; min = 1; time = 0;
-parenb -parodd -cmspar cs8 hupcl -cstopb cread clocal -crtscts
-ignbrk -brkint -ignpar -parmrk -inpck -istrip -inlcr -igncr icrnl ixon -ixoff -iuclc
-ixany -imaxbel -iutf8
opost -olcuc -ocrnl onlcr -onocr -onlret -ofill -ofdel nl0 cr0 tab0 bs0 vt0 ff0
isig icanon iexten echo echoe echok -echonl -noflsh -xcase -tostop -echoprt echoctl
echoke -flusho -extproc这里其实和开发板是有些参数不一样的,后面会有开发板的串口参数,我们用下面的命令修改:
sudo stty -F /dev/ttyS0 115200 -icrnl -icanon -echo2.2 SSH 登录开发板
用户  --- 用户名 -- 密码
超级用户 - root -- root
普通用户 - cat -- temppwd2.2.1 指定 IP - SSH 登录
2.2.2 root用户登录
LubanCat系统镜像出厂默认是不支持root用户SSH登录的,如果想要设置SSH登录root用户需要修改设置,修改方法如下:
# 1. 修改文件/etc/ssh/sshd_config
sudo sh -c 'echo "PermitRootLogin yes" >> /etc/ssh/sshd_config'

# 2.重启sshd服务
sudo systemctl restart sshdroot用户SSH登录的方式和普通用户登录方式是一样的,只是把用户名从 “cat” 修改为 “root”,密码从”temppwd”改为”root”,此处不再赘述,可以参考前面小节如何登录。
2.3 确定开发板串口节点
2.3.1 dmesg信息
我们输入下面的命令查找 dmesg 信息中 tty 相关打印信息:
root@lubancat:~/nfs_temp# dmesg | grep "tty"
[    1.071638] Kernel command line: storagemedia=emmc androidboot.storagemedia=emmc androidboot.mode=normal root=/dev/mmcblk0p3 boot_part=2 earlyprintk console=ttyFIQ0 console=tty1 consoleblank=0 loglevel=7 rootwait rw rootfstype=ext4 #s-04/13/2026 androidboot.fwver=ddr-v1.23-03ea844c5d,spl-v1.14,bl31-v1.44,bl32-v2.15,uboot-6da0e4a
[    1.286461] printk: console [tty1] enabled
[    1.325795] Registered FIQ tty driver
[    1.902668] printk: console [ttyFIQ0] enabled
[    1.902845] Registered fiq debugger ttyFIQ0
[ 16.139077] ttyFIQ ttyFIQ0: tty_port_close_start: tty->count = 1 port count = 2这些日志我们一个一个分析。
(1)Kernel command line: ... console=ttyFIQ0 console=tty1 ...
内核启动参数中指定了两个控制台设备。console=ttyFIQ0 表示将 FIQ 调试串口作为第一个控制台;console=tty1 表示将第一个虚拟终端(屏幕)也作为控制台。内核的 printk 消息会同时输出到这两个设备上(即串口和 HDMI/LCD 显示的 tty1)。先指定的优先级更高,所以 ttyFIQ0 是主控制台。
(2)``printk: console [tty1] enabled`
内核成功激活了 tty1 作为控制台。这意味着 屏幕上的第一个虚拟终端(Ctrl+Alt+F1) 现在可以接收内核打印的消息了。
(3)Registered FIQ tty driver
FIQ(Fast Interrupt Request)TTY 驱动程序已注册到内核。FIQ 是 ARM 架构下的一种高优先级中断机制,用于实现低延迟的串口调试(通常用于 Rockchip 平台的 fiq_debugger)。与普通串口驱动不同,FIQ TTY 驱动可以在系统严重卡顿时依然响应串口输入,非常适合调试。
(4)printk: console [ttyFIQ0] enabled
内核成功激活了 ttyFIQ0 作为控制台。ttyFIQ0 对应的是开发板上的调试串口(通常通过 UART 转 USB 连接到 PC)。自此,内核日志也会输出到该串口。
(5)Registered fiq debugger ttyFIQ0
FIQ 调试器(fiq_debugger)已经注册并绑定到 ttyFIQ0 设备。这表明该串口不仅仅是普通 TTY,还具备 FIQ 调试能力,可以在系统死锁时通过特殊按键(如 Ctrl+C)进入调试模式。开发板调试时,可以通过串口与正在运行的内核进行交互(如查看调用栈、触发崩溃转储等)。
2.3.2 /dev/ttyFIQ0
所以其实分析到现在,可以知道,设备这边的串口设备名是 /dev/ttyFIQ0,我们还可以确认一下,我们通过ssh登录一下开发板,然后通过串口也登陆开发板,我们在ssh这端通过下面的命令发送数据:
echo "hello" > /dev/ttyFIQ0
echo "world" > /dev/ttyFIQ0然后看串口的终端是否有输出信息,会发现是有的:
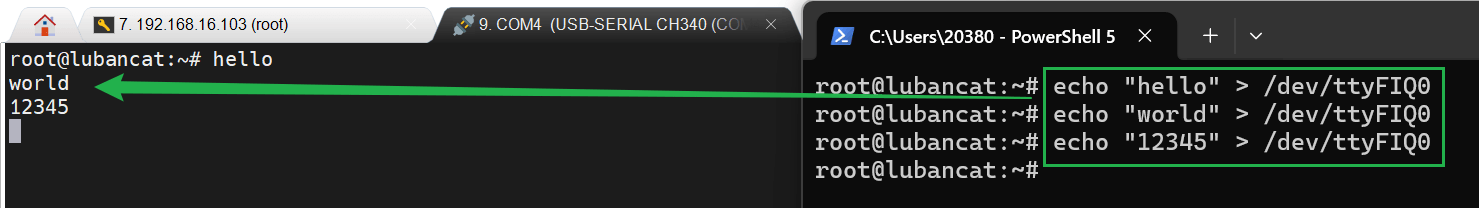
Tips:也可以直接在串口终端向 /dev/ttyFIQ0 发送数据,同样会打印到串口终端。
所以我们可以确认,这个就是设备这边的串口设备节点了(对应我们实际的硬件串口)。/dev/tty1是虚拟终端 (Virtual Console),内核通用 VT 子系统 (绑定 framebuffer),主要是用于本地人机交互、命令行界面、图形界面。我们可以通过下面的命令查看这个串口设备节点的信息:
stty -F /dev/ttyFIQ0 -a # 查看当前串口参数在这里就是:
root@lubancat:~# stty -F /dev/ttyFIQ0 -a
speed 115200 baud; rows 24; columns 200; line = 0;
intr = ^C; quit = ^\; erase = ^?; kill = ^U; eof = ^D; eol = <undef>; eol2 = <undef>; swtch = <undef>; start = ^Q; stop = ^S; susp = ^Z; rprnt = ^R; werase = ^W; lnext = <undef>; discard = <undef>;
min = 1; time = 0;
-parenb -parodd -cmspar cs8 hupcl -cstopb cread -clocal -crtscts
-ignbrk brkint ignpar -parmrk -inpck -istrip -inlcr -igncr -icrnl ixon -ixoff -iuclc -ixany imaxbel iutf8
opost -olcuc -ocrnl onlcr -onocr -onlret -ofill -ofdel nl0 cr0 tab0 bs0 vt0 ff0
isig -icanon -iexten -echo echoe echok -echonl -noflsh -xcase -tostop -echoprt echoctl echoke -flusho -extproc2.4 通过串口连接
- 开发板
cd /root/nfs_temp/c-leaning
./arm-aarch64-none-linux-gnu-gdbserver /dev/ttyFIQ0 a.out # 启动开发板上的 gdbserver- ubuntu
cd ~/workspace/cnb-lubancat/gdb-10.2/build-pc/_install/bin
./arm-pc-aarch64-none-linux-gnu-gdb -q
(gdb) target remote /dev/ttyS02.5 小结
这里呢,我是没有尝试成功的,还是网口最简单,后续有机会再深入研究吧,暂不浪费时间。
参考资料: